Zero-Lag Scalper with Trend Line (BUY/SELL labels) BY RAHZero-Lag Scalper with Trend Line (BUY/SELL labels) BY RAH
Cari dalam skrip untuk "Buy sell"

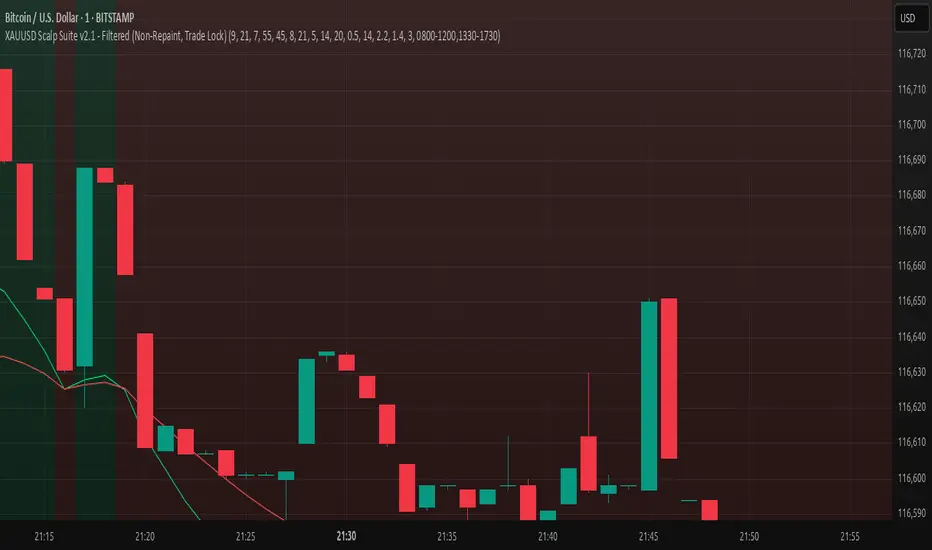
Scalp Suite v1 – Non-Repaint BUY/SELL with TP/SL & Trade LockA complete scalping tool designed for 1m–5m charts on FX pairs, Gold (XAUUSD), and indices.
Features:
• Non-repaint BUY/SELL signals based on EMA trend, RSI, and optional MACD filter
• ATR-based dynamic SL, TP1, TP2
• Automatic trade lock – no new signals until current trade closes
• Break-even move after TP1 hit (optional)
• Session filter to trade only during the most active market hours
• Customizable visuals: entry, SL, TP lines and trade labels
• Alerts for BUY and SELL signals
Best used with:
• Low-spread brokers
• Active market sessions (e.g., London + NY overlap)
• Strict risk management (0.5–1% per trade)
⚠ For educational purposes only. Not financial advice.
Razor Precision — Buy/SellRazor Precision Stock Action Indicator
The Razor Precision indicator is an advanced, multi-layered market analysis tool designed for traders who demand accuracy and alignment across multiple timeframes. It combines price action, moving average crossovers, volume confirmation, swing structure mapping, and indicator confluence (RSI, MACD, ATR, OBV) to generate actionable buy/sell strength ratings.
Key Features:
Price Action Detection: Identifies higher highs/lows (uptrend) and lower highs/lows (downtrend).
MA Crossover Momentum: Monitors 50/200 moving average crossovers to detect trend shifts.
Volume Surge Analysis: Confirms breakouts or pullbacks with significant volume spikes.
Swing Structure Tracking: Maps internal/external breaks to align with Smart Money Concepts.
Indicator Confluence: Aggregates signals from RSI, MACD, ATR, and OBV for precision confirmation.
Multi-Timeframe Alignment: Compares trends across 15m, 1H, 4H, and Daily charts for stacked or conflicting signals.
Strength Levels: Signals range from SELL, STRONG SELL, ULTRA STRONG SELL to BUY, STRONG BUY, ULTRA STRONG BUY.
Dynamic Table Display: Updates every 5 minutes or when overall action changes, showing per-timeframe analysis and the aggregated decision.
Ideal for swing traders, scalpers, and intraday momentum players who want high-confidence trade direction filtered through multiple technical layers.

RSI + MACD + EMA Buy/Sell ComboRSI + MACD + EMA Buy/Sell Combo with signals if all 2 lines up it will create buy and cell signals
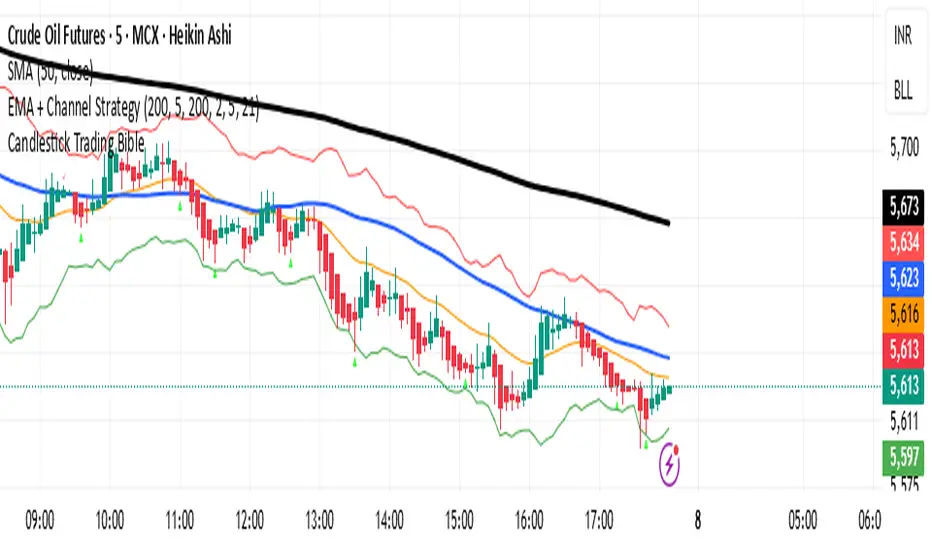
EMA + Channel Strategy prefect buy / sell signalN45 EMA + Channel Strategy prefect buy / sell signal
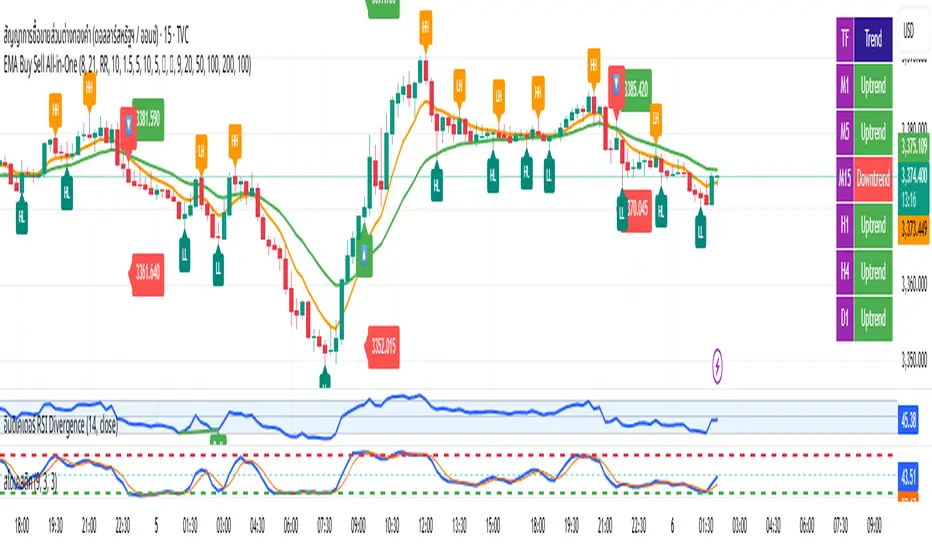
EMA Buy Sell All-in-One✨ Description (แนะนำให้ใช้ตอนกด Publish):
This all-in-one indicator combines several powerful trading tools into one script:
• EMA Cross Entry System: Customizable fast/slow EMA cross for buy/sell signals
• Dynamic SL/TP System: Choose between swing-based or custom SL/TP; auto-calculated RR support
• HH, HL, LH, LL Labels: Market structure points marked directly on chart (toggle ON/OFF)
• Multi-Timeframe Trend Table: Visual overview of EMA trends across D1 → M1 timeframes
• H1 Trend Change Icons: Alerts when the hourly trend flips direction
➤ Clean and responsive display
➤ Fully customizable via input panel
➤ Great for intraday or swing traders following trend + structure alignment
Feel free to fork or modify. Made for those who want clarity and confluence in one view.
WaveTrend LazyBear + BUY/SELL Labels (Custom Color)WaveTrend LazyBear + BUY/SELL Labels (Custom Color)

Ultimate Precision Buy/Sell with SL - Clean Labels FIXThis is a premium indicator designed for traders who demand accuracy, simplicity, and clean visual signals.
✅ Key Features:
📈 Precise Buy/Sell entries based on trend confirmation (EMA) and momentum (RSI)
🛡️ Automatic Stop Loss (SL) drawn for every trade, calculated from ATR
🔄 SL line dynamically moves with each new candle to reflect live action
❗ Only one active signal at a time – no clutter, no repaints
⏱ Optimized for 1H timeframe
💰 Best for Forex pairs, Gold (XAUUSD), Silver (XAGUSD), Platinum (XPTUSD)
🧠 How it works:
Buy Signal: When fast EMA > slow EMA & RSI crosses above 30
Sell Signal: When fast EMA < slow EMA & RSI crosses below 70
A single SL line is drawn per trade and remains until either:
Opposite signal appears, or
SL is hit
⚠️ No repainting. No noise. Just precision.
If you want to trade smart, clean and with confidence – this indicator is built for you.

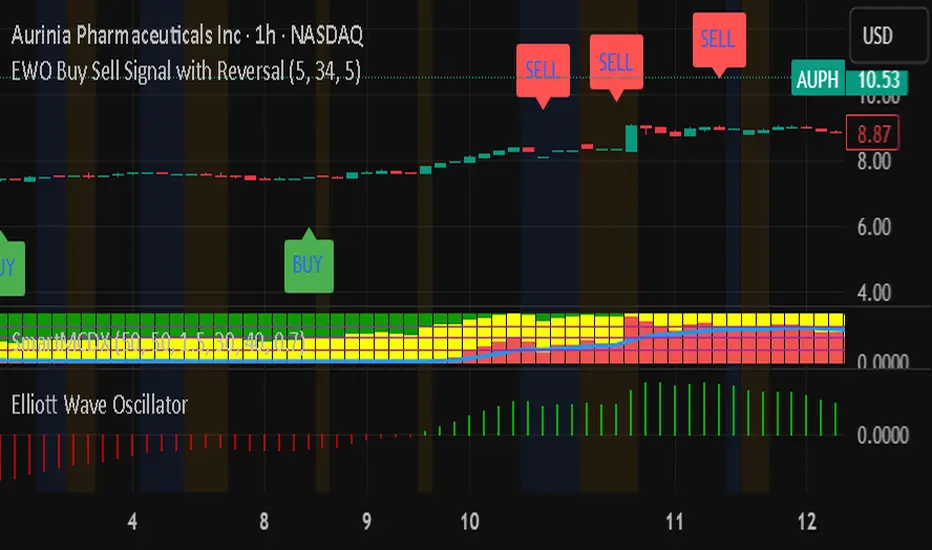
EWO Buy Sell Signal with ReversalEWO Buy Sell Signal with Reversal EWO Buy Sell Signal with Reversal EWO Buy Sell Signal with Reversal EWO Buy Sell Signal with Reversal
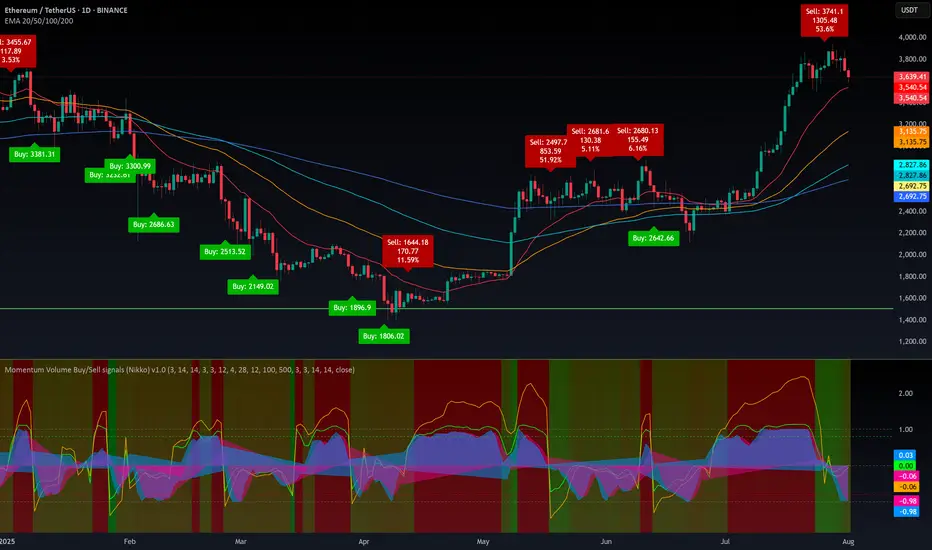
Momentum Buy/Sell signals (Nikko) v1.0📊 Momentum Volume Box Range Buy/Sell Signals (Nikko) v1.0
This indicator is a multi-factor momentum-based tool that helps identify potential Buy and Sell signals:
🔍 What it does
It combines several well-known indicators into a hybrid signal system and displays heatmaps, momentum lines, and Buy/Sell labels.
📈 How to use it
Buy Signals are shown when the hybrid K line crosses above D line in strong downward zones (oversold).
Sell Signals appear when K crosses below D, but only if a minimum profit % is reached since the last Buy.
The background heatmap color changes based on combined RSI and Vortex intensity:
Greenish = Bullish strength
Reddish = Bearish weakness
🟢 Buy/Sell Labels
Buy Labels: Triggered when strong downward momentum reverses (or price drops deeply).
Sell Labels: Only shown if price has moved up by the user-defined % profit since the last Buy.
🔧 Customization Options
You can toggle on/off:
Heatmap
Hybrid signal lines
Buy/Sell labels
Stochastic RSI area plot
Volume range and profile
EMA overlays (20, 50, 100, 200)
All major color elements are adjustable for visual clarity.
💡 Best Practices
Use on any timeframe, but it works best with higher timeframes (1H+).
Look for convergence between strong heatmap color and hybrid signal crossover.
Combine with price action or EMA trend context for better accuracy.
Note: This indicator is designed as a trading companion, not a standalone strategy. It combines multiple timeframes and parameters that would be difficult to monitor manually. Its purpose is to visually simplify complex signals, helping reduce the risk of poor entries.
However, it's essential to also consider macroeconomic factors, news events, and overall market sentiment, as they can significantly impact price action. Always use proper risk management and do your own research (DYOR).
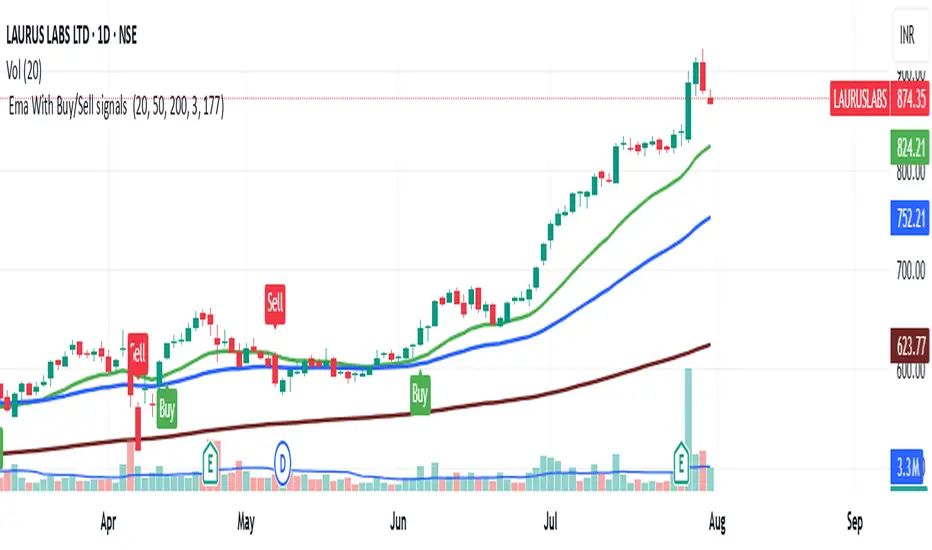
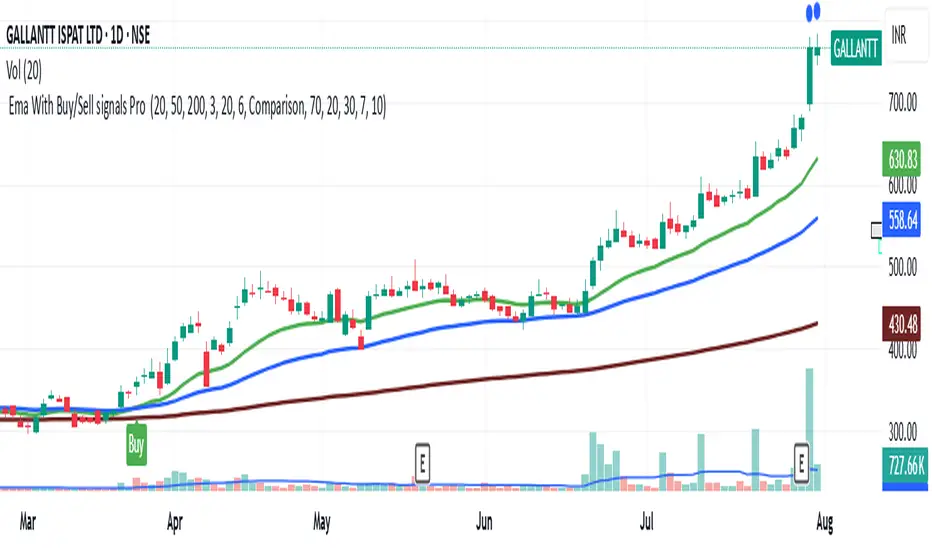
Ema With Buy/Sell signals EMA With Buy/Sell Signals – Trend Following & Volatility Breakout Suite
This indicator delivers a powerful combination of trend clarity and actionable signal generation for traders of any skill level. It overlays three customizable Exponential Moving Averages (EMAs) with an adaptive ATR-based trailing stop and automatic Buy/Sell labels, allowing you to spot and capitalize on major market moves with confidence.
Core Features
Triple EMA Overlay (20, 50, 200):
Plots three EMAs with user-defined lengths, helping you visually identify trend direction and dynamic support/resistance zones.
EMA 1 (green): Fast and responsive to recent price moves.
EMA 2 (blue): Captures medium-term trend structure.
EMA 3 (Brown): Represents long-term trend and core support/resistance.
ATR-Based Trailing Stop & Signals:
Uses Average True Range (ATR) with a customizable lookback and multiplier to set an automated trailing stop that adjusts to volatility.
Buy labels trigger when price breaks above the trailing stop with bullish momentum; Sell labels trigger on bearish breaks below the stop.
Small, color-coded labels (green for Buy, red for Sell) are plotted directly on your chart for instant decision-making.
How to Use
Trend Trading: Follow the EMAs for overall trend direction; take Buy signals during uptrends and Sell signals during downtrends for higher accuracy.
Customization: Fine-tune EMA periods, ATR multiplier, and trailing stop period to fit any trading style—from scalping to long-term investing.
Ema With Buy/Sell Signals Pro This advanced multi-tool indicator combines Exponential Moving Averages (EMAs), dynamic buy/sell signal logic, ATR-based trailing stops, and a custom volume profile heatmap, delivering a complete solution for identifying trend direction, momentum shifts, and high-activity price zones.
Core Components & Features
📊 1. Triple EMA Overlay
Plots 20, 50, and 200 EMA lines on the chart.
Visualizes short-term, medium-term, and long-term trend directions.
Acts as dynamic support/resistance levels and trend confirmation tools.
💡 2. Smart Buy/Sell Signal System (ATR-Based)
Utilizes an ATR Trailing Stop to detect trend reversals.
Generates Buy signals when price breaks above the ATR stop and confirms strength.
Generates Sell signals when price breaks below the ATR stop and confirms weakness.
Optionally triggers alerts on crossover signals to capture momentum moves early.
📈 3. ATR Extension Signal
Highlights strong momentum bursts using a price/ATR divergence logic.
Filters conditions where price is significantly extended from the 50 EMA.
Plots blue circles above bars to indicate potential breakout continuation.
🧮 4. Volume Profile Heatmap (Custom Coded)
Plots a horizontal Volume Distribution Profile over a customizable lookback window.
Visualizes buy vs sell volume density across price levels using colored boxes:
Green = Buy Dominant
Red = Sell Dominant
5. Fully Customizable Inputs
Adjustable EMAs, ATR period, multipliers, and signal sensitivity.
Fine-tune volume profile resolution, scale, and transparency.
Turn ON/OFF heatmap and lookback visualization for cleaner charts.
✅ Best Use-Cases
Trend-following strategies with reliable momentum confirmation.
Entry/exit signals based on volatility-adjusted stop loss logic.
Spotting key liquidity zones, support/resistance bands, and volume imbalances.
Works for intraday, swing, and position trading.
High Probability Buy/Sell with SL & TP High-accuracy Buy/Sell signals with dynamic SL & Target—perfect for scalpers and swing traders,Smart trading signals with built-in risk management. Never miss a move.Auto Buy/Sell entries with real-time SL & TP levels—trade with confidence.Turn signals into strategy. Precision entries, clear exits.Your all-in-one trading assistant: entry, stop loss, and take profit—automated.Built for serious traders: Clean signals, sharp exits, and solid risk-reward.

Twin Range Filter V2 – Buy/Sell Signals📊 Indicator Name: Twin Range Filter – Buy/Sell Signals
📝 Description:
The Twin Range Filter is a trend-following indicator that combines two adaptive volatility filters to identify potential market reversals and trend continuations. It uses two configurable smoothing periods (fast and slow) to calculate a dynamic range around price, filtering out market noise and highlighting meaningful shifts in direction.
This indicator plots BUY and SELL signals based on price action in relation to the range filter, as well as internal trend conditions.
✅ How It Works:
Long Signal (BUY) is triggered when:
Price is above the filtered range (showing strength), and
Short-term upward momentum is confirmed.
Short Signal (SELL) is triggered when:
Price is below the filtered range (showing weakness), and
Short-term downward momentum is confirmed.
The signals are highlighted using green "Long" and red "Short" labels on the chart.
Background colors reinforce the current directional bias.
⚙️ Inputs:
Fast Period & Range: Adjust sensitivity of the fast range filter.
Slow Period & Range: Adjust smoothing of the slow range filter.
Source: Choose which price to base calculations on (e.g., Close, Open, HL2, etc.)
🔔 Alerts:
Long Signal – A new BUY condition has been detected.
Short Signal – A new SELL condition has been detected.
📌 Use Cases:
Entry timing for swing or intraday trades
Trend confirmation filter
Signal generator in automated strategies (when paired with a strategy scrip
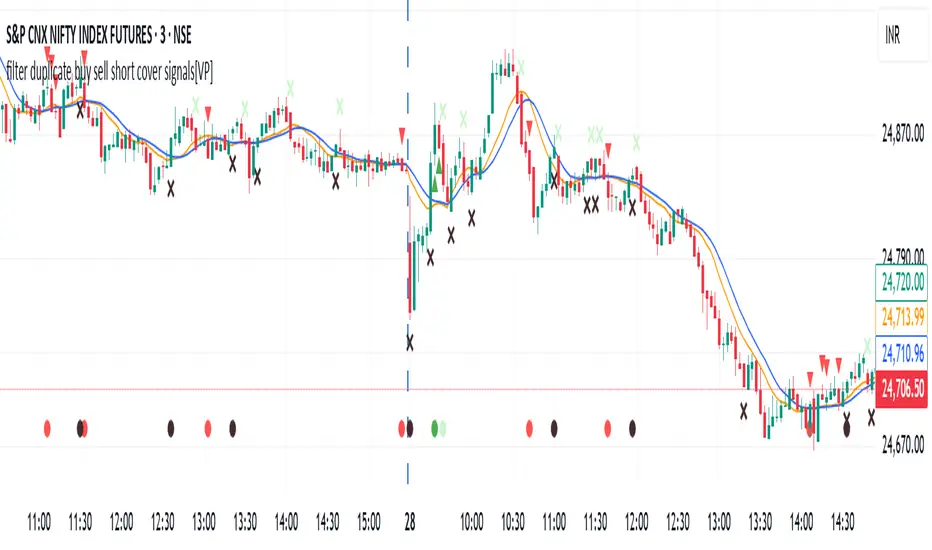
filter duplicate buy sell short cover signals[VP]I was looking for an indicator that would filter signals but could only find solutions for a buy/sell system. I couldn't locate one that dealt with buy/sell AND short/cover.
The indicator expands the idea from the link:
stackoverflow.com
Trend Buy/Sell Fibonacci Range - KLTThe Trend Buy/Sell Fibonacci Range – KLT indicator identifies bullish and bearish trends based on where the closing price is located within a Fibonacci range calculated from the last N candles (default is 10). Instead of analyzing individual candles, this tool takes a broader view of price action using Fibonacci retracement levels across a dynamic multi-candle range.
How It Works:
Range Calculation
The indicator calculates the highest high and lowest low over the last N candles to define the active price range (default: 10 bars).
Fibonacci Levels
Within this range, Fibonacci levels (0.236, 0.382, 0.5, 0.618, 0.786) are dynamically computed. These levels act as internal thresholds to evaluate bullish or bearish pressure.
Trend Identification (via Close Position):
If the closing price is above the 0.618 level, it indicates strong buy pressure → the candle turns green and an upward triangle appears.
If the closing price is below the 0.382 level, it suggests strong sell pressure → the candle turns red and a downward triangle is displayed.
If the close lies between 0.382 and 0.618, the market is considered neutral, and the candle is gray.
Visual Elements:
Colored candles to immediately spot trend conditions.
Triangle signals (optional) for clear Buy/Sell markers.
Fibonacci level lines plotted on the chart for full context (can be toggled on/off).
Customization Options:
Lookback period (number of candles to calculate the range)
Fibonacci threshold levels (upper/lower)
Show/hide arrows and Fibonacci lines
Why Use This Indicator?
This tool is perfect for traders who want a simple visual method to assess trend strength based on price structure, not indicators derived from lagging moving averages. It offers:
Cleaner market structure analysis
Objective trend zones
Customizable sensitivity
Recommended Use:
Works well in conjunction with support/resistance zones, volume, or momentum indicators.
Applicable to any asset class or timeframe.
Credits:
Developed by KLT, combining structure-based logic with Fibonacci precision.

O.C. buy/sell by maliwru + TP & SL + TableO.C. Buy/Sell + TP/SL + Table — by maliwru
This indicator detects trade entry signals based on the Opening Candle strategy using the first bar of the trading session.
🔍 Key Features:
Automatic session time detection (Saudi, US, or Custom)
Visual Buy/Sell signals
Auto-calculated and drawn Take Profit 1/2/3 and Stop Loss
SL can be set by % or points
Supports VWAP and EMA200 overlays
Real-time chart labels and lines
Trade summary table showing last 2 trades with TP/SL status
💡 Best for:
Intraday traders
Session range-based setups
Open range breakout strategies
📋 Customizable Settings:
Session time
Colors
Candle duration (in ms)
SL/TP modes and levels
📘 User Guide:
O.C. Buy/Sell + TP/SL + Table — by maliwru
Open Candle Session Breakout Indicator with Auto TP/SL and Trade Summary Table
🔎 What is this indicator?
This indicator detects high-probability Buy/Sell signals based on the first (Opening) candle of a trading session. It is built for intraday traders who want to capitalize on early session breakouts with predefined TP and SL levels, along with clear visual feedback.
🧠 How it works:
Opening Candle (O.C.):
At the start of the selected session (e.g. Saudi, US, or Custom), the first candle is marked as the reference or opening candle.
Signal Generation:
Buy signal is triggered when price breaks above the high of the opening candle.
Sell signal is triggered when price breaks below the low of the opening candle.
Take Profits & Stop Loss:
TP1, TP2, and TP3 are automatically plotted using customizable multipliers.
SL is calculated based on % risk, point distance, or a fixed method — all adjustable in settings.
Trade Summary Table:
The indicator displays the last 2 signals with:
Direction (Buy/Sell)
Entry Price
TP/SL levels
TP/SL hit status (real-time update)
⚙️ Settings Overview
Category Description
Session Type Choose between Saudi, US, or Custom. Automatically adjusts to session start times.
Custom Session Time If Custom is selected, manually set start hour & minute.
VWAP / EMA200 Toggle overlays for VWAP and EMA200 for confluence analysis.
SL Mode Select from % of entry, fixed points, or auto from O.C. range.
TP Multipliers Set levels for TP1, TP2, TP3 (e.g. 1.0x, 1.5x, 2.0x of O.C. range).
Colors & Style Customize candle colors, TP/SL lines, signal arrows, and table style.
Candle Duration (ms) Optional — for tick-based setups or special sessions.
✅ Benefits
🔄 Automatic session detection: Works out of the box for Saudi and US markets.
🎯 Precise entry logic: Based on real breakout of the first session candle.
📉 Risk management built-in: SL and TP levels auto-calculated.
📊 Visual clarity: Real-time labels, arrows, and TP/SL lines on chart.
📈 VWAP & EMA200 filters: Help avoid false breakouts.
📋 Compact trade summary: Table shows entry, outcome, and hit levels.
🔧 Fully customizable: Adjust almost every aspect to fit your strategy.
💡 Tips for Best Use
Use it on 5m to 30m charts for intraday setups.
Combine with volume spikes, VWAP, or EMA200 for confirmation.
Avoid trading during low liquidity or high-impact news releases.
Experiment with different TP/SL multipliers depending on market volatility.
Use table status to review recent trade performance at a glance.
📌 Example Workflow
Set session type = US Market
Wait for the first candle to complete after market open
If price breaks above candle high → Buy
If price breaks below candle low → Sell
SL and TP levels are drawn automatically
Track results in the live table

Williams Fractals with Buy/Sell Signals🧠 Concept:
This indicator is based on the concept of fractal swing highs and lows, commonly used in Bill Williams’ trading methods. A fractal forms when a candle’s high or low is higher/lower than a set number of candles on both sides. This structure helps identify local market turning points.
⚙️ Inputs:
Fractal Sensitivity (swingSensitivity):
Number of candles required on each side of the central bar to validate a fractal.
For example, if set to 2, a swing high is detected when a bar’s high is higher than the previous 2 bars and the next 2 bars.
✅ Features:
Fractal Detection:
Plots white triangles above swing highs (down fractals).
Plots white triangles below swing lows (up fractals).
Buy/Sell Signals:
Buy Signal: Triggered when the candle closes above the most recent down fractal.
Sell Signal: Triggered when the candle closes below the most recent up fractal.
Signals alternate — a Buy must follow a Sell and vice versa to reduce noise.
Signal Labels:
"BUY" label appears below the candle in green.
"SELL" label appears above the candle in red.
Alerts:
Real-time alerts are available for both Buy and Sell signals via alertcondition().
📌 Use Case:
This indicator can help you:
Detect short-term reversals.
Confirm breakouts or structure shifts.
Time entries with clear logic based on price action.
Intraday BUY/SELL & AUTO SL (5-min timeframe only) by chaitu50c)Intraday BUY/SELL & AUTO SL (5-min timeframe only) by chaitu50c
This indicator provides intraday traders with BUY/SELL reversal signals and automated SL (Stoploss) tracking, based on a 3-candle reversal block logic — designed to work exclusively on the 5-min timeframe.
Key Features:
• 3-Candle Reversal Logic — Signals are generated when a defined 3-candle reversal pattern is detected (body-close breakout).
• Current Session Only — All signals and SL lines are valid only for the current session and automatically reset at session start.
• BUY/SELL Signal Labels — Visual ▲ and ▼ labels mark valid reversal signals on the chart.
• Dynamic Auto SL Lines — Plots dashed SL lines based on the reversal block's low/high.
• SL HIT Tracking — If SL is broken, the line stops extending and a ‘SL HIT’ label is displayed at the midpoint of the SL line.
• Adjustable Visual Settings — Customize signal label size, SL line width, colors, and more.
• Clean & Lightweight — Optimized for intraday use without cluttering the chart.
How to Use:
You can trade this indicator in two ways:
1. Direct Signal Entry — Take a BUY or SELL trade when a valid ▲/▼ reversal signal forms.
2. SL HIT Re-entry — If an existing SL line is broken and ‘SL HIT’ appears, you can optionally take an opposite side trade in the direction of the SL HIT.
Example:
A BUY signal is generated and an SL line is plotted below.
If price breaks the SL (SL HIT appears), you may consider entering a SELL trade at that point — as it indicates weakness.
Important Notes:
• Works only on 5-min timeframe — Set your chart to 5-min for correct behavior.
• Designed for intraday trading — all signals and SL levels reset at session start.
• Does not carry signals between sessions.
• SL lines and HIT labels provide a clear and simple visual aid for trade management.
---

GEEKSDOBYTE IFVG w/ Buy/Sell Signals1. Inputs & Configuration
Swing Lookback (swingLen)
Controls how many bars on each side are checked to mark a swing high or swing low (default = 5).
Booleans to Toggle Plotting
showSwings – Show small triangle markers at swing highs/lows
showFVG – Show Fair Value Gap zones
showSignals – Show “BUY”/“SELL” labels when price inverts an FVG
showDDLine – Show a yellow “DD” line at the close of the inversion bar
showCE – Show an orange dashed “CE” line at the midpoint of the gap area
2. Swing High / Low Detection
isSwingHigh = ta.pivothigh(high, swingLen, swingLen)
Marks a bar as a swing high if its high is higher than the highs of the previous swingLen bars and the next swingLen bars.
isSwingLow = ta.pivotlow(low, swingLen, swingLen)
Marks a bar as a swing low if its low is lower than the lows of the previous and next swingLen bars.
Plotting
If showSwings is true, small red downward triangles appear above swing highs, and green upward triangles below swing lows.
3. Fair Value Gap (3‐Bar) Identification
A Fair Value Gap (FVG) is defined here using a simple three‐bar logic (sometimes called an “inefficiency” in price):
Bullish FVG (bullFVG)
Checks if, two bars ago, the low of that bar (low ) is strictly greater than the current bar’s high (high).
In other words:
bullFVG = low > high
Bearish FVG (bearFVG)
Checks if, two bars ago, the high of that bar (high ) is strictly less than the current bar’s low (low).
In other words:
bearFVG = high < low
When either condition is true, it identifies a three‐bar “gap” or unfilled imbalance in the market.
4. Drawing FVG Zones
If showFVG is enabled, each time a bullish or bearish FVG is detected:
Bullish FVG Zone
Draws a semi‐transparent green box from the bar two bars ago (where the gap began) at low up to the current bar’s high.
Bearish FVG Zone
Draws a semi‐transparent red box from the bar two bars ago at high down to the current bar’s low.
These colored boxes visually highlight the “fair value imbalance” area on the chart.
5. Inversion (Fill) Detection & Entry Signals
An inversion is defined as the price “closing through” that previously drawn FVG:
Bullish Inversion (bullInversion)
Occurs when a bullish FVG was identified on bar-2 (bullFVG), and on the current bar the close is greater than that old bar-2 low:
bullInversion = bullFVG and close > low
Bearish Inversion (bearInversion)
Occurs when a bearish FVG was identified on bar-2 (bearFVG), and on the current bar the close is lower than that old bar-2 high:
bearInversion = bearFVG and close < high
When an inversion is true, the indicator optionally draws two lines and a label (depending on input toggles):
Draw “DD” Line (yellow, solid)
Plots a horizontal yellow line from the current bar’s close price extending five bars forward (bar_index + 5). This is often referred to as a “Demand/Daily Demand” line, marking where price inverted the gap.
Draw “CE” Line (orange, dashed)
Calculates the midpoint (ce) of the original FVG zone.
For a bullish inversion:
ce = (low + high) / 2
For a bearish inversion:
ce = (high + low) / 2
Plots a horizontal dashed orange line at that midpoint for five bars forward.
Plot Label (“BUY” / “SELL”)
If showSignals is true, a green “BUY” label is placed at the low of the current bar when a bullish inversion occurs.
Likewise, a red “SELL” label at the high of the current bar when a bearish inversion happens.
6. Putting It All Together
Swing Markers (Optional):
Visually confirm recent swing highs and swing lows with small triangles.
FVG Zones (Optional):
Highlight areas where price left a 3-bar gap (bullish in green, bearish in red).
Inversion Confirmation:
Wait for price to close beyond the old FVG boundary.
Once that happens, draw the yellow “DD” line at the close, the orange dashed “CE” line at the zone’s midpoint, and place a “BUY” or “SELL” label exactly on that bar.
User Controls:
All of the above elements can be individually toggled on/off (showSwings, showFVG, showSignals, showDDLine, showCE).
In Practice
A bullish FVG forms whenever a strong drop leaves a gap in liquidity (three bars ago low > current high).
When price later “fills” that gap by closing above the old low, the script signals a potential long entry (BUY), draws a demand line at the closing price, and marks the midpoint of that gap.
Conversely, a bearish FVG marks a potential short zone (three bars ago high < current low). When price closes below that gap’s high, it signals a SELL, with similar lines drawn.
By combining these elements, the indicator helps users visually identify inefficiencies (FVGs), confirm when price inverts/fills them, and place straightforward buy/sell labels alongside reference lines for trade management.

Crystal Buy Sell Liquidity📖 Crystal Buy Sell Liquidity (Crystal BSL)
The Crystal Buy Sell Liquidity (Crystal BSL) is an educational tool designed to support traders in recognizing directional bias and potential liquidity-based reversal zones—particularly during the first hour of market activity. It highlights potential Buy and Sell signals using intuitive labels and optional color-coded candles for improved visual clarity.
This indicator is built for traders who prefer a structured, rule-based approach without the need to constantly interpret raw market data.
📘 How It Works:
Optimized for use on the 1-hour (H1) timeframe.
The script analyzes price behavior during the first session hour to determine potential areas of interest.
Buy and Sell labels appear when key conditions based on market structure and liquidity are met.
Optional candle coloring enhances directional context.
✅ Suggested Use:
Entry: Enter trades when a Buy or Sell label appears and aligns with your personal trading strategy.
Exit / Trade Management:
Consider exiting the trade if the price closes beyond the opposite side of the signal candle.
Use your own risk-reward criteria to set stop loss and take profit.
Always apply responsible risk management.
🔧 Features:
Clean, customizable Buy/Sell signal labels.
Optional color-coded bars for clarity.
Built-in alerts to notify signal events in real-time.
Toggle visibility options for cleaner charts.
⚠️ Important Disclaimer:
This indicator is intended solely for educational purposes. It does not provide financial advice and should not be considered a signal service or investment recommendation. Trading involves risk, and all decisions are made at the user’s discretion. Past performance is not a guarantee of future results. Always test and validate any trading strategy thoroughly before using it in live market conditions.

CHN BUY SELL with EMA 200Overview
This indicator combines RSI 7 momentum signals with EMA 200 trend filtering to generate high-probability BUY and SELL entry points. It uses colored candles to highlight key market conditions and displays clear trading signals with built-in cooldown periods to prevent signal spam.
Key Features
Colored Candles: Visual momentum indicators based on RSI 7 levels
Trend Filtering: EMA 200 confirms overall market direction
Signal Cooldown: Prevents over-trading with adjustable waiting periods
Clean Interface: Simple BUY/SELL labels without clutter
How It Works
Candle Coloring System
Yellow Candles: Appear when RSI 7 ≥ 70 (overbought momentum)
Purple Candles: Appear when RSI 7 ≤ 30 (oversold momentum)
Normal Candles: All other market conditions
Trading Signals
BUY Signal: Triggered when closing price > EMA 200 AND yellow candle appears
SELL Signal: Triggered when closing price < EMA 200 AND purple candle appears
Signal Cooldown
After a BUY or SELL signal appears, the same signal type is suppressed for a specified number of candles (default: 5) to prevent excessive signals in ranging markets.
Settings
RSI 7 Length: Period for RSI calculation (default: 7)
RSI 7 Overbought: Threshold for yellow candles (default: 70)
RSI 7 Oversold: Threshold for purple candles (default: 30)
EMA Length: Period for trend filter (default: 200)
Signal Cooldown: Candles to wait between same signal type (default: 5)
How to Use
Apply the indicator to your chart
Look for yellow or purple colored candles
For LONG entries: Wait for yellow candle above EMA 200, then enter BUY when signal appears
For SHORT entries: Wait for purple candle below EMA 200, then enter SELL when signal appears
Use appropriate risk management and position sizing
Best Practices
Works best on timeframes M15 and higher
Suitable for Forex, Gold, Crypto, and Stock markets
Consider market volatility when setting stop-loss and take-profit levels
Use in conjunction with proper risk management strategies
Technical Details
Overlay: True (plots directly on price chart)
Calculation: Based on RSI momentum and EMA trend analysis
Signal Logic: Combines momentum exhaustion with trend direction
Visual Feedback: Colored candles provide immediate market condition awareness
